Stocks go up, stocks go down, can’t pick a top and can’t pick a bottom.
However–Spotify is a particularly interesting stock for a number of reasons, mostly having to do with the nature of the initial offering. Remember, Spotify did not offer shares in an “initial public offering,” they used an untried method called a “direct public offering.”
The difference is crucial. In an IPO, or as it’s more precisely known, a “full commitment underwriting,” the company (or “issuer”) actually raises money through selling new shares of stock to a group of investors, usually banks. These investors are often called “underwriters”. In the case of a full commitment underwriting IPO, the company sells shares to an underwriting group (or “syndicate“) and the syndicate then sells those shares to the public after the syndicate decides the valuation of the company and the price of the shares of stock.
This is completely different from the direct public offering. There are no new shares, there is no syndicate, and the price is set (or was for Spotify) by reference to the price of shares selling in the private market immediately before the public is able to buy–and my bet is that the DPO price was a lot higher than an IPO price would have been. (Dropbox, for example, priced at $21 and closed at $28.48 on its first day of trading. Facebook priced at $38, Google at $85, Alibaba $68, Amazon was $18. All had different valuations, of course. Spotify priced at $132 using a loophole from the SEC. And what goes up, must come down.)
So, you may ask, if the issuer doesn’t sell shares to an underwriting syndicate, where do the shares come from?
The shares come from insiders at the company and any other shareholder, employee, record company, other investors already holding shares who want to get out. All of these insiders have an incentive to keep the share price as high as they can before they get their shares sold to the bigger fool…sorry, I mean to other investors.
According to a puff piece that Spotify’s lawyers conveniently wrote and published at a Harvard Law School meeting (wonder who paid for that), Spotify identified three goals in their DPO:
-
Offer greater liquidity for its existing shareholders [translation: existing shareholders can cash out], without raising capital itself and without the restrictions imposed by standard lock-up agreements
-
Provide unfettered access to all buyers and sellers of its shares, allowing Spotify’s existing shareholders the ability to sell their shares immediately after listing at market prices [this essentially repeats benefit #1]
-
Conduct its listing process with maximum transparency and enable market-driven price discovery
That last one is utter gibberish as the SEC takes care of the transparency through Form S-1 (or F-1 in Spotify’s case as a foreign filer) and Regulation S-K. The first point is really two related but different goals: lockup agreements bar employees and key holders from dumping their stock for a typical 180 day period. This is to avoid high employee turnover after a public offering the way we’ve seen at companies like…you know…Spotify. It’s generally thought that losing key employees is bad for shareholders, so that’s why every mother’s daughter has lock up agreements. It’s also hard to recruit replacements when the insiders are selling, especially if the stock is tanking.
And one can’t help noticing that building a sustainable business model for long-term shareholder value and artist longevity is not on the list.
Anyway…if you look at the following chart, you’ll see some interesting patterns developing over the short history of Spotify’s stock. I don’t put a lot of trust in chart analysis, but some people do and it is one of the few things we have to rely on in this case because there is so much insider activity.
You’ll notice that there’s something of a “head and shoulders” pattern emerging when the stock reached its high on July 26, 2018 of $196.28. This pattern is often associated with a move to the downside, sometimes a sharp move to the downside.
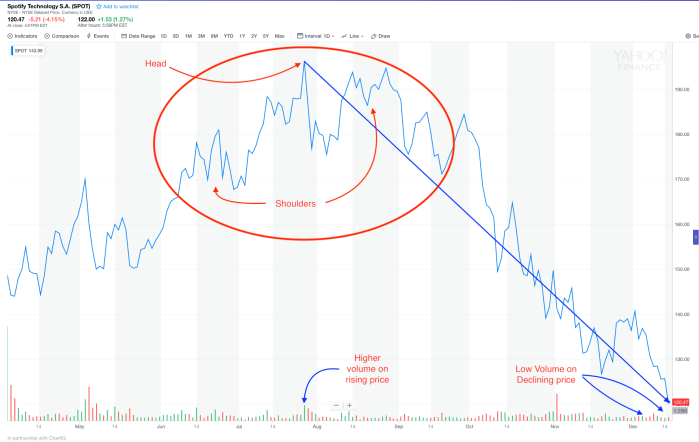
Sure enough, the stock went into a sputtering dive the next day and the dive has continued ever since. Note that at the high, volume was rising. The low volume of Spotify stock is another one of the untold stories and is another suggestion of price management in the background.
Once the downside move became apparent, which was about October 10, downward pressure accelerated on rising volume (relatively speaking since volume is low). A couple weeks later, more sell signals confirmed the downside move.
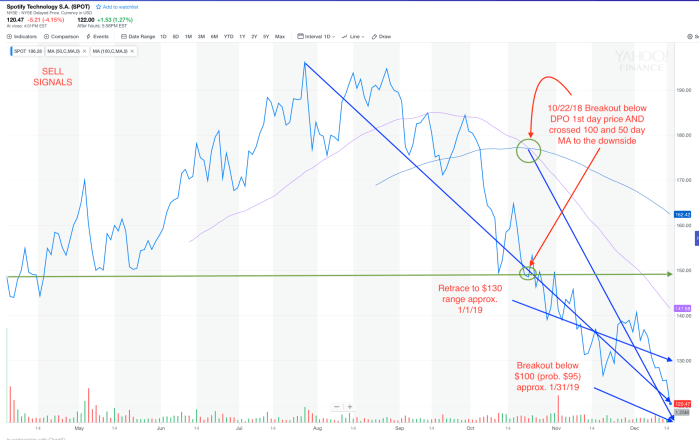
One signal that I found significant was the 50 and 100 day moving averages of the stock price crossed to the downside on October 22, which also happened to be the date that the stock traded and closed at $148.54–below $149.01, the closing price on the first day of trading.
Starting with the high at the head and shoulders formation, the stock has more or less collapsed on about a 45 degree downward angle ever since. Why is that? Possibly because the stock was priced too high to begin with. Some people think that SPOT is just reacting to the overall market sell-off. I don’t think that is true as SPOT has not moved in relation to the market since inception. SPOT was higher on the market highs and lower on the market lows, so I don’t see the coupling argument at all.
Plus, Spotify announced a $1 billion stock buy back, so the price is rapidly declining in spite of the buyback. Perhaps if Spotify had made a tender offer for shares at a fixed price, they could have supported the stock more successfully.
Based on the stock’s recent history, it would not be surprising to see SPOT retrace some of its collapse and rise to something in the $120-$130 range by the end of the year. Then I suspect that it will decline to approximately $95 around the end of January.
After that, we shall see. Obviously, this is not investment advice, just speculation based on some guesses derived from the chart. But the chart is relevant because there’s unlikely to be any real change in the company’s financial position in the next six weeks.
Analyst Mark Hake has developed three different scenarios for where Spotify’s stock price will be in 2021: $125.68, $61.42 and $38.39, but assigns a $114.89 price based on a probability analysis. About where it is now, in other words. His post in Seeking Alpha (“Spotify Has A Valuation Problem”) is a must read if you’re interested in financial analysis.
Spotify closed today at $116.50, down $2.17 in after hours trading.
