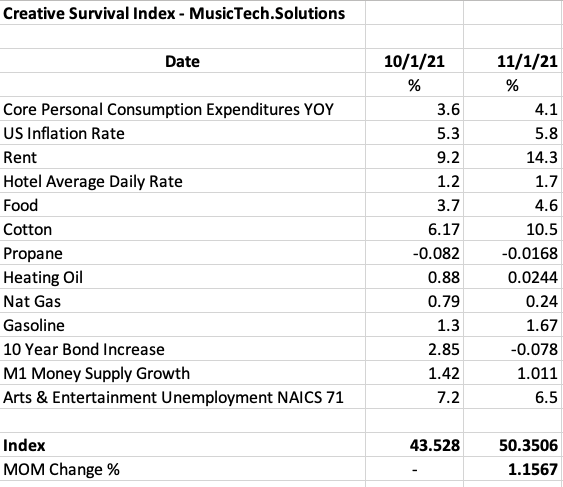
Our second month of the Creative Survival Index shows a few trends that may be interesting. First, core inflation indicators are up as has been widely reported. Keep in mind that at the beginnings of an inflationary surge firms may choose to absorb price increases of their inputs or vendors before passing those price increases on to consumers in the form of more expensive finished goods. That’s why we look at basic inputs like cotton, energy and the cost of money as well as essential goods like food and rent.
Because we’re focused on measuring sustainability in the creative economy, particularly music, we look at hotel rates and gasoline which directly affect touring, as well as the unemployment rate in arts and entertainment (which is coded NAICS 71).
We follow money supply growth to measure demand pull “too much money chasing too few goods” type inflation.
The index is a simple arithmetic sum of all these various indicators which is not a true econometric model, so take that into consideration. We’ve put this index together because there hasn’t ever been one so this is just a start for discussion.
What appears to be happening is that as the index increases, life gets intuitively harder. We’ll see how these trends develop.
